








Customer Experience · August 7, 2026
Turning Raw Data Into Customer Centricity Decisions
Most organisations drown in customer data yet starve for decisions. Here is how to close the gap between measurement and meaningful action.

Most organisations have more customer data than they know what to do with. They have NPS scores, CSAT surveys, call-centre transcripts, app-usage logs, churn models, and CRM records stretching back years. What they rarely have is a clear line between that data and a decision that actually changes how a customer feels. That gap — between data collected and decision made — is where customer centricity either lives or dies.
The problem is not measurement. The problem is interpretation, and the organisational will to act on what interpretation reveals.
What Customer Centricity Actually Means — and Why the Definition Matters
Defining customer centricity precisely is not a semantic exercise. It is the foundation on which every measurement, strategy, and intervention rests. A vague definition produces vague action.
Customer centricity is the systematic prioritisation of customer outcomes — not customer preferences — in every significant business decision, from product design to process architecture to resource allocation. The distinction between outcomes and preferences is critical. Customers prefer frictionless checkout; the outcome they need is confidence that their purchase was correct. Designing for the preference alone produces a fast but hollow experience. Designing for the outcome produces loyalty.
This framing matters enormously when you turn to data. If you are measuring only what customers say they want (satisfaction scores, feature requests), you are measuring preferences. If you are measuring what actually changes their behaviour — repeat purchase, advocacy, reduced churn, increased share of wallet — you are measuring outcomes. The business case for customer centricity rests entirely on outcome metrics, not on satisfaction scores alone.
Why the Business Case for Customer Centricity Is Stronger Than Most Boards Acknowledge
The commercial argument for customer centricity is not a soft one dressed up in hard language. It is structurally sound. Customers who trust a brand spend more over time, cost less to retain, and refer others at a rate that no paid acquisition channel can match. The compounding effect of even a modest improvement in retention is significant — and unlike a marketing campaign, it does not switch off when the budget runs out.
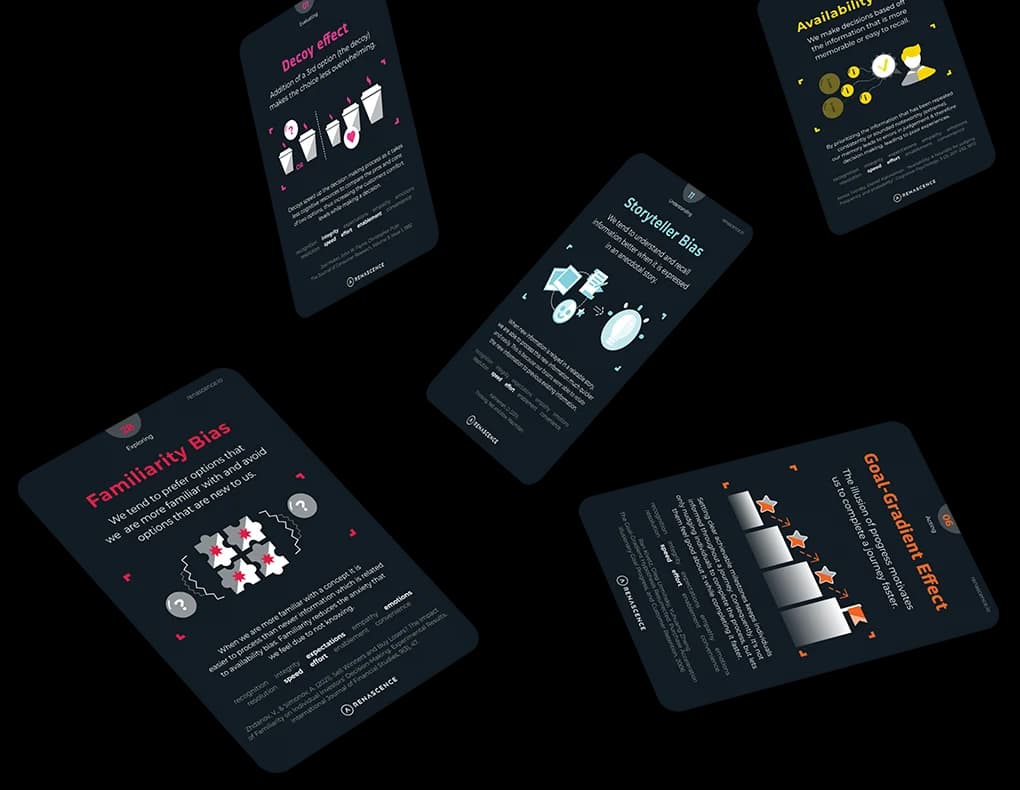
The mechanism is straightforward: every reduction in customer effort and every increase in perceived fairness raises the probability of the next purchase. Daniel Kahneman's research on the peak-end rule — the finding that people judge an experience primarily by its most intense moment and its final moment, not its average — explains why a single excellent resolution of a complaint can overturn months of mediocre service. Conversely, a single egregious failure at the end of an otherwise adequate journey can erase all prior goodwill. The implication for resource allocation is direct: invest disproportionately in moments of truth and in endings, not in uniform incremental improvement across every touchpoint.
The organisations that have internalised this argument do not treat CX investment as a cost centre. They treat it as a demand-generation mechanism with a measurable return. If you want to quantify that return for your own organisation, the CX ROI Calculator provides a structured starting point for building the internal business case.
The Common Customer Centricity Mistakes That Data Cannot Fix Alone
Data is necessary but not sufficient. The most common failure mode in customer centricity programmes is not a shortage of data — it is a set of structural and interpretive errors that prevent data from becoming decision. Here are the ones that recur most reliably.
- Averaging away the signal. Aggregate NPS scores hide the distribution. A score of 35 can represent a healthy majority of promoters with a small tail of detractors, or it can represent a deeply polarised customer base with almost no one in the middle. The two situations demand entirely different responses. Always segment before you conclude.
- Measuring satisfaction instead of effort and emotion. Satisfaction is a lagging indicator of a past experience. Customer Effort Score (CES) and emotional-arc data tell you where friction is accumulating before it becomes churn. Most organisations measure the wrong thing and then wonder why their scores do not predict behaviour.
- Treating feedback as a reporting exercise. Surveys go out, scores come back, a slide goes into the quarterly deck, and nothing changes. This is not a Voice of Customer strategy — it is a ritual that produces the illusion of listening without the substance of it. Customers notice. The act of asking and not acting is itself a trust-destroying touchpoint.
- Confusing correlation with causation in churn models. A customer who reduces their purchase frequency before churning is not churning because of reduced frequency — they are reducing frequency because something in the experience has already broken. Churn models that flag the symptom rather than the cause send intervention teams to the wrong moment in the journey.
- Siloing data by department. The customer experiences a single, continuous journey. The organisation experiences it as marketing data, operations data, finance data, and customer service data — each owned by a different team, each optimised for a different metric. The result is a journey that is locally optimised and globally incoherent.
How to Measure Customer Centricity With Rigour
Measuring customer centricity means measuring the degree to which customer outcomes are actually driving decisions — not merely the degree to which customers report being satisfied. The two are related but not the same.
A credible measurement framework operates at three levels simultaneously.
Level 1: Perception Metrics
These are the scores customers give you directly — NPS, CSAT, CES. They are valuable as directional signals and as benchmarks over time, but they should never be the primary basis for a strategic decision. They tell you how customers feel about what happened; they do not tell you what caused it or what to change.
Level 2: Behavioural Metrics
These are the metrics that reveal what customers actually do — repeat purchase rate, share of wallet, time between transactions, referral rate, and channel switching behaviour. Behavioural metrics are harder to game than perception scores and more directly connected to commercial outcomes. A customer who gives you a 9 on NPS but has not purchased in eight months is a different problem from a customer who gives you a 7 and buys every quarter.
Level 3: Operational Metrics
These measure the quality of the experience you are delivering, independent of what customers report — resolution rate on first contact, wait times, error rates, process completion rates, digital drop-off points. Operational metrics are leading indicators: they tell you where the experience is likely to break before customers have had time to tell you it already has.
The organisations that are genuinely achieving customer centricity connect all three levels into a single view, mapped against the customer journey. A spike in call-centre contacts (operational) that correlates with a drop in CES (perception) in the same journey stage, followed by a reduction in repeat purchase (behavioural) two months later, is a causal chain you can act on. Any one metric in isolation is an anecdote.
Understanding how these metrics map to each stage of the customer relationship is covered in depth in Understanding the Customer Experience Lifecycle.
Turning Raw Data Into Customer Centricity Decisions: A Practical Framework
The translation from data to decision is not automatic. It requires a structured process, clear ownership, and the organisational authority to act on what the data reveals. Here is the sequence that works in practice.
- Map the journey before you map the data. Data without a journey map is a collection of disconnected readings. Before you can interpret what the data means, you need a shared, agreed view of the stages the customer moves through, the touchpoints within each stage, and the jobs the customer is trying to accomplish at each one. Without this, different teams will interpret the same data differently — and they will all be partially right, which is worse than being wrong.
- Assign a quantified experience score to each touchpoint. Not a qualitative label ("this touchpoint is problematic") but a scored, comparable value that allows you to rank touchpoints by their impact on the overall experience. This transforms journey mapping from a workshop artefact into a decision-support tool. The scoring should account for both the emotional intensity of the moment and its frequency — a rare but catastrophic touchpoint and a frequent but mildly frustrating one require different interventions.
- Identify the moments of truth. Not every touchpoint carries equal weight. The peak-end rule tells us that the moments customers remember — and the moments that drive their subsequent behaviour — are the peaks (positive or negative) and the final moment of the journey. Identify these explicitly. They are where your data should be most granular and where your improvement investment should be most concentrated.
- Cross-reference perception, behavioural, and operational data at the touchpoint level. A touchpoint that scores poorly on CES, shows high drop-off in digital analytics, and correlates with increased inbound contacts is a confirmed problem. A touchpoint that scores poorly on CES alone may be a perception issue, a process issue, or an expectation issue — and each requires a different response.
- Convert insight into a ranked improvement roadmap. Every confirmed problem should translate into a specific initiative with an owner, a timeline, and a success metric. The ranking should be based on a combination of impact (how much does fixing this move the outcome metrics?) and effort (what does it cost to fix?). High-impact, low-effort improvements should be actioned immediately — not because they are the most important, but because visible progress builds the internal credibility that sustains longer-term transformation.
- Close the loop with customers. When a change is made in response to customer feedback, tell the customers who gave that feedback. This is not a courtesy — it is a trust-building mechanism. The reciprocity principle (Cialdini) holds that people who receive something of value are more likely to give something in return. A customer who sees their feedback acted upon is more likely to give honest feedback next time, more likely to feel heard, and more likely to remain loyal.
Examples of Customer Centricity Done With Data Discipline
Concrete examples are more useful than abstract principles, so consider two patterns that recur across industries.
The first is the complaint-to-loyalty conversion. Organisations that track complaint resolution at the touchpoint level — not just aggregate complaint volumes — consistently find that customers whose complaints are resolved quickly and with genuine acknowledgement of the failure report higher loyalty scores than customers who never complained at all. The mechanism is the peak-end rule in action: the resolution becomes the peak moment, and it is a positive one. The data implication is that complaint data should be treated as a loyalty-building signal, not merely a service-failure metric. Organisations that route complaint data only to quality assurance teams miss the commercial opportunity entirely.
The second pattern is proactive friction removal. In sectors where the customer journey involves significant documentation or process complexity — banking, real estate, healthcare, government services — the organisations that use operational data to identify where customers stall or abandon, and then proactively contact those customers before they disengage, consistently outperform those that wait for customers to raise the issue. This is the goal-gradient effect at work: customers who are close to completing a process are more likely to complete it if they receive a timely nudge that reduces the perceived distance to the finish line. The data that enables this intervention is almost always already available — it just is not being used for this purpose.
For sector-specific patterns, the Banking and Finance CX page covers how these dynamics play out in financial services, where data complexity and regulatory constraints create a distinctive set of challenges.
Implementing Customer Centricity: The Organisational Conditions That Make Data Actionable
Data discipline is necessary but not sufficient. The organisations that successfully implement customer centricity share a set of structural conditions that allow data to flow into decisions without being filtered out by departmental politics or short-term commercial pressure.
- A single owner of the customer journey. Not a committee. Not a shared responsibility between marketing and operations. One person or function with the authority to convene others, make trade-offs, and be held accountable for outcome metrics. Without this, data findings become recommendations that no one is obligated to act on.
- Customer metrics in the executive scorecard. If the metrics that determine leadership performance are purely financial — revenue, margin, cost — then customer data will always lose the prioritisation argument. The organisations that achieve customer centricity at scale have made at least one customer outcome metric (typically retention rate or lifetime value) a board-level number.
- A feedback loop that operates at the speed of the business. Monthly NPS reports cannot drive weekly operational decisions. The data infrastructure needs to support near-real-time signals for high-frequency touchpoints and periodic deep analysis for strategic decisions. These are different tools serving different purposes, and conflating them produces neither.
- Cross-functional access to journey data. The product team, the operations team, the digital team, and the customer service team should all be looking at the same journey map with the same data. Separate dashboards optimised for separate functions produce separate optimisations — and a customer who experiences the seams.
Assessing where your organisation currently sits on this spectrum is the starting point for any realistic improvement plan. The CX Maturity Assessment provides a structured diagnostic across twelve building blocks, including data and measurement capability.
Customer Centricity Strategies That Sustain Beyond the Initial Programme
The graveyard of CX transformation is littered with programmes that produced excellent diagnostic work, generated a compelling roadmap, and then faded when the sponsoring executive moved on or the budget cycle turned. Sustaining customer centricity requires embedding it into the operating rhythm of the organisation, not treating it as a project with a start and end date.
Three strategies consistently separate organisations that sustain progress from those that stall.
The first is making customer data a standard input to every significant business decision — not a separate stream that runs in parallel. When a pricing change, a process redesign, or a product launch is evaluated, customer journey impact should be part of the standard assessment, not an afterthought. This requires that the data is accessible, interpretable, and trusted by the people making those decisions.
The second is investing in the employee experience as the upstream driver of customer experience. Frontline employees who understand the customer journey, have access to the data that describes it, and have the authority to resolve problems in the moment are the most effective CX intervention available. No process redesign compensates for a frontline that is disempowered, uninformed, or disengaged. The connection between employee experience and customer experience is not a soft cultural claim — it is a measurable operational dependency.
The third is treating CX maturity as a continuous improvement discipline, not a destination. The organisations that sustain customer centricity do not declare victory when scores improve. They use improved scores as the baseline for the next diagnostic cycle, continuously raising the standard against which they measure themselves. This is the discipline that separates organisations that achieve customer centricity from those that merely aspire to it.
For a deeper examination of how the theory of customer centricity translates — and sometimes fails to translate — into real-world practice, Customer Centricity Books vs. Real-World Practice: The Gap is worth the time.
The Data You Already Have Is Enough to Start
The organisations that wait for a perfect data infrastructure before acting on customer centricity are making a category error. The data required to identify your most damaging touchpoints, your most at-risk customer segments, and your highest-leverage improvement opportunities almost certainly already exists in your organisation. It is sitting in call-centre logs, in churn models, in digital analytics, and in the complaints that your service teams handle every day.
The work is not to collect more data. The work is to connect the data you have to a journey map, score it with discipline, and build the organisational conditions that allow the resulting insight to become a decision — and then a change that a customer actually notices.
Customer centricity is not a philosophy that requires a data transformation programme to begin. It is a decision-making discipline that begins the moment you look at the data you already have and ask, seriously, what it is telling you about the experience you are actually delivering — and what you are prepared to do about it.
Further reading
FAQ
Questions we get on this topic
Related reading



Stay ahead of CX
Get the Journal in your inbox.
Insights, frameworks and event round-ups from the Renascence team. No spam, ever.