








Customer Loyalty · November 3, 2026
Churn Rate vs Retention Rate: What the Gap Actually Means
Churn and retention aren't mirror images of the same metric — mapping churn to the service blueprint finds the fail point that retention rate only mourns.

Retention rate tells you how many customers you kept. Churn rate tells you how many you lost. Most dashboards report both and explain neither — because the gap between the two numbers is where the actual story lives, and that story is written in the service blueprint, not the spreadsheet.
Here is the answer, stated plainly: churn rate and retention rate are mathematical inverses of roughly the same population over roughly the same period, but they are not interchangeable diagnostics. Retention rate is a portfolio-level, backward-looking health check. Churn rate, broken down by cohort, touchpoint and moment of truth, is the only one of the two that tells you where in the journey the relationship actually broke. Treating them as the same metric is why so many "retention strategies" are really just discount campaigns aimed at a problem nobody has located yet.
What is the difference between churn rate and retention rate?
Churn rate measures the percentage of customers who left during a period; retention rate measures the percentage who stayed. At a surface level they're complementary — in a closed cohort with no new customers entering, churn rate plus retention rate equals 100%. In practice, most businesses report retention and churn against a moving customer base, which means the two figures can diverge, and that divergence itself is diagnostic.
The standard formulas:
- Churn rate = (Customers lost during period ÷ Customers at start of period) × 100
- Retention rate = ((Customers at end of period − New customers acquired during period) ÷ Customers at start of period) × 100
Run 1,000 customers through a quarter. You lose 80 and gain 120 new ones. Churn rate is 8%. Retention rate — measuring only the original 1,000, not the new arrivals — is 92%. The two numbers look like opposites and, in this clean case, they are. But add a wrinkle common in subscription and banking businesses — customers who downgrade, pause, or go dormant without formally cancelling — and the two metrics start measuring different populations entirely. A telecom provider can show flat churn while retention quietly erodes among a specific tenure cohort, because "churned" is defined contractually while "retained" is defined behaviourally. That mismatch is not a reporting error. It's a clue.
Why do retention rate and churn rate tell two different stories?
Because they sit at different altitudes of the same service blueprint. Retention rate lives above the line of visibility — it's the number a board sees, a lagging aggregate that confirms something went wrong last quarter. Churn rate, decomposed by stage and touchpoint, lives at the line of interaction, where the customer actually met the organisation and decided, consciously or not, whether the relationship was still worth the effort.
A service blueprint maps customer actions against frontstage staff actions, backstage processes and support systems, exposing the fail points invisible in a journey map alone. When churn is logged only as a monthly or quarterly percentage, it tells you the temperature of the whole body. When it's logged against the blueprint — which onboarding step, which renewal call, which app screen, which escalation path — it tells you exactly where the fever started. Renascence's CX journey mapping work exists precisely because most churn post-mortems stop at the aggregate number and never reach the specific fail point that caused it.
A retention rate is an epitaph. A churn rate mapped to the blueprint is a post-mortem — and only one of those helps you prevent the next death.
This is also why churn and retention, measured in isolation, invite the wrong fix. A falling retention number tends to get answered with loyalty points, a discount, or a "win-back" email — interventions aimed at the customer's wallet, not the journey's broken step. If the actual fail point is a 20-minute call-centre queue at renewal, no amount of points fixes it. Loyalty programme design only works once the underlying service has stopped leaking.
Where in the journey does churn actually happen?
Overwhelmingly, churn clusters at a handful of predictable moments of truth: the first 30–90 days after onboarding, the renewal or billing event, and the first unresolved complaint. This isn't a coincidence of timing — it's behavioural economics doing exactly what it predicts.
Loss aversion (Kahneman & Tversky) means a customer who has invested time setting up a service, importing data, or training a team feels the prospective loss of switching far more acutely than the prospective gain of staying — which is precisely why churn that does happen in the first 90 days is disproportionately diagnostic of a genuinely broken early experience, not just price sensitivity. If someone churns before the endowment effect has had time to take hold, the product failed on its own terms.
The peak-end rule, described by Daniel Kahneman in Thinking, Fast and Slow (Farrar, Straus and Giroux, 2011), explains why a single terrible renewal call can erase twelve months of adequate service. Customers don't average their experience across a year; they remember the peak (good or bad) and the ending. A blueprint that scores every touchpoint equally will miss this. One that weights the renewal conversation and the last support interaction more heavily will catch it.
Practically, this means churn analysis has to be stage-aware, not just cohort-aware:
- Onboarding churn — signals a mismatch between what was sold and what was delivered, or a service blueprint with too many handoffs before first value.
- Mid-life churn — usually a sign of unresolved friction accumulating quietly: repeated low-grade issues that never individually trigger a complaint but collectively erode goodwill.
- Renewal-point churn — often price-triggered on the surface, but the underlying driver is frequently a peak-end failure: a bad support experience shortly before the renewal decision.
- Post-complaint churn — the costliest and most preventable, because the customer gave the organisation a direct signal and the resolution step in the blueprint failed to close the loop.
Why does churn spike right before renewal — and right after onboarding?
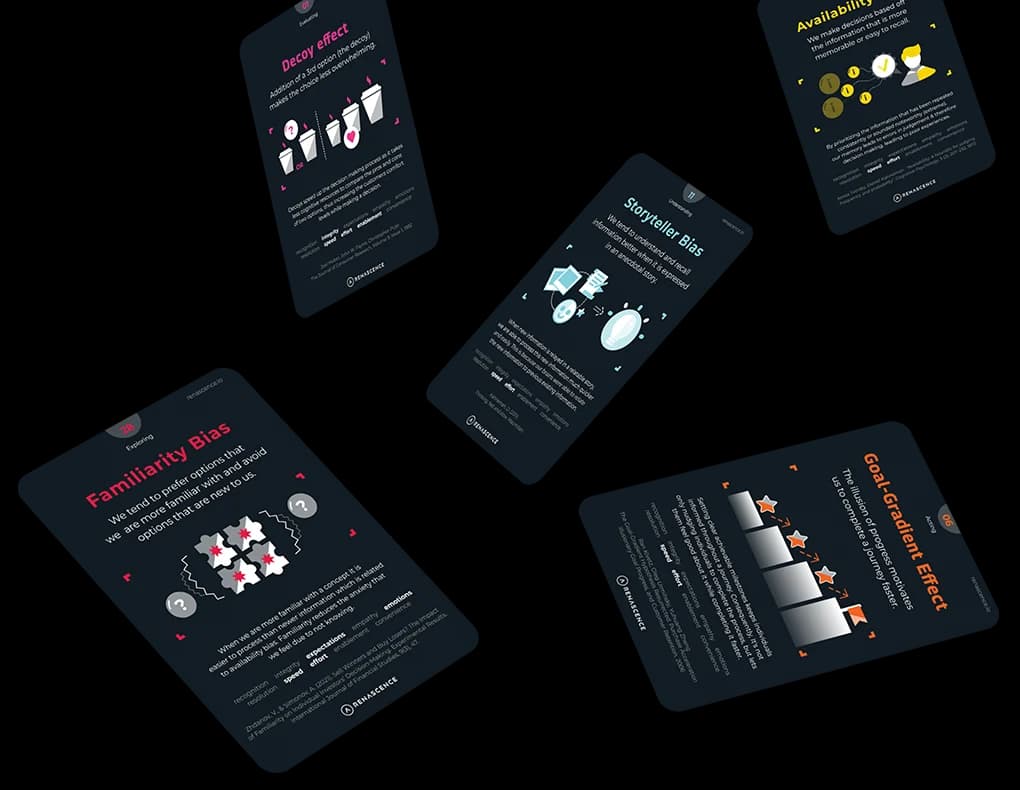
Because of the goal-gradient effect — the well-documented tendency for motivation to intensify as people approach a goal, and to slacken just after achieving one. Ran Kivetz, Oleg Urminsky and Yuhuang Zheng formalised this in a 2006 study published in the Journal of Marketing Research, showing that loyalty-card customers accelerated purchases as they neared a reward threshold, then slowed sharply once they'd redeemed it. Apply that lens to churn and the pattern is obvious: a customer's engagement peaks right up to activation (the "goal" of getting set up) and then drops off a cliff once that goal is achieved — exactly the window in which onboarding churn concentrates, because nothing in the blueprint was designed to re-anchor them toward the next goal.
The same mechanic runs in reverse at renewal. As the renewal date approaches, a customer re-evaluates the relationship with unusual intensity — it's a visible, fast-approaching decision point, the behavioural equivalent of a finish line. Any friction encountered in that window carries outsized weight. This is why a service blueprint built for a subscription or membership business should treat the 60 days either side of onboarding completion, and the 60 days either side of renewal, as distinct zones requiring their own fail-point audit — not folded into a single annual churn number.
How do you calculate churn and retention correctly?
Get the formula wrong and every downstream decision inherits the error. Follow this sequence:
- Define the cohort boundary. Decide whether "customers at start of period" includes trial users, paused accounts, or only fully active paying customers. Inconsistent boundaries are the single most common reason churn and retention numbers don't reconcile.
- Separate voluntary from involuntary churn. A failed payment is not the same signal as a deliberate cancellation. Blending the two hides genuine dissatisfaction inside what is really a payments-ops problem.
- Calculate churn rate as customers lost divided by customers at the start of the period, multiplied by 100.
- Calculate retention rate on the same original cohort — excluding new acquisitions — so the two figures are genuinely comparable rather than measuring different populations.
- Segment by tenure cohort before you segment by anything else. A blended churn rate across customers in month one and customers in year three will always understate the problem at either end.
- Map each lost cohort back to the service blueprint — which stage, which touchpoint, which frontstage or backstage failure — rather than stopping at the percentage.
- Re-run the calculation monthly on a rolling basis, not just quarterly, so a fast-moving fail point doesn't hide inside an averaged number.
The reason this sequence matters commercially is well established. Frederick Reichheld and W. Earl Sasser Jr., in their 1990 Harvard Business Review article "Zero Defections: Quality Comes to Services", demonstrated that even small reductions in customer defection rates could lift profits substantially, because the cost of acquiring a replacement customer dwarfs the cost of keeping an existing one. That finding, now over three decades old, still holds because the underlying economics — acquisition cost versus retention cost — haven't changed; only the channels have.
How do you diagnose churn with a service blueprint instead of a dashboard?
A churn number without a blueprint behind it is a temperature reading without a diagnosis. Here's the audit I run with clients once churn or retention moves outside its normal band:
- Pull the lost cohort, not the aggregate. Identify every customer who churned in the window and tag their tenure, plan, channel and last known touchpoint.
- Rebuild their specific journey on the blueprint — customer actions, frontstage interactions, backstage processes, support systems — for the 90 days preceding exit.
- Flag the fail points — the backstage breakdowns (a billing system glitch, an understaffed renewal queue) that produced the frontstage symptom the customer actually experienced.
- Weight by recency and intensity, applying the peak-end logic: a single severe failure close to the exit date usually outweighs several minor frictions spread across the relationship.
- Cross-reference against voice-of-customer data — survey verbatims, complaint logs, call transcripts — mapped to the same stage, so the quantitative churn signal and the qualitative reason align.
- Prioritise fixes at the fail point, not the symptom. If renewal-stage churn is driven by call-centre wait times, the fix is staffing or process redesign at that backstage step — not a renewal discount.
- Re-measure the specific touchpoint, not just the headline churn rate, over the following cycle to confirm the fix actually closed the gap.
This is, in effect, a retention audit disguised as a mapping exercise — and it's the same discipline behind service design work generally: you don't redesign an entire journey because one stage is leaking, and you don't accept an entire journey as healthy because the aggregate number looks fine.
What counts as a "good" churn or retention rate?
There is no single healthy benchmark, and any article that hands you one without naming the sector, business model and customer tenure mix is guessing. A monthly subscription media business, a B2B SaaS platform on annual contracts, and a retail bank's current-account book operate on entirely different churn physics, and comparing their raw percentages is close to meaningless. What's consistent across all of them is the direction of the economic argument Reichheld and Sasser set out: retained customers tend to cost less to serve over time, refer others, and grow in value, while each percentage point of unwanted churn has to be replaced through acquisition spend that is almost always more expensive than the retention fix would have been. If you want to put a number on that trade-off for your own business rather than borrow someone else's industry average, Renascence's CX ROI Calculator is built for exactly that exercise, and the independent analysis in our piece on the Watermark Consulting CX ROI study is worth reading alongside it for a market-level view of how experience quality tracks shareholder return over time.
It's also worth being precise about a distinction that gets collapsed too often: churn and retention are not the same thing as loyalty. A customer can be retained — still paying, still logged in — while being one competitor offer away from leaving, with zero emotional attachment to the brand. That's retention without loyalty, and it's a fragile state dressed up as a healthy metric. We've written separately about exactly where that line sits in Customer Retention vs Customer Loyalty: What's the Difference?, and it's essential reading before you celebrate a retention number that might be measuring inertia rather than genuine preference.
What should actually change in how churn gets reported?
Most organisations report churn the way a hospital would report mortality without ever opening a chart: a single number, trending up or down, with no record of cause. The fix isn't a better dashboard. It's refusing to accept a churn or retention figure without the blueprint underneath it — the specific stage, touchpoint and backstage failure that produced it. Build that discipline once, and every future churn spike stops being a mystery the board debates for a quarter and becomes a fail point someone fixes in a sprint.
If your team is still debating retention percentages in a meeting with no journey data to back them, that's the real gap to close first — not the number on the slide. Renascence's CX journey and service blueprint work is designed to put that missing layer back underneath the metric, so the next time retention moves, you already know exactly where it happened and what to do about it. For a broader read on how maturely your organisation currently handles these signals, our CX Maturity Assessment is a useful starting point, and if you'd rather talk it through directly, get in touch with Renascence.
Further reading
FAQ
Questions we get on this topic
Related reading



Writing on how human behavior shapes the experiences brands deliver — at the intersection of behavioral economics and customer experience.
Stay ahead of CX
Get the Journal in your inbox.
Insights, frameworks and event round-ups from the Renascence team. No spam, ever.