








Service Design · July 22, 2026
Journey Mapping Tools Jargon: What CX Leaders Must Know
Most journey mapping exercises fail because the room can't agree on definitions. This guide cuts through the jargon so CX leaders can map, decide, and act.

Most journey mapping exercises fail before anyone picks up a marker. They fail because the room is full of smart people who cannot agree on what they are actually mapping — and the tools they are using let them argue indefinitely in comfortable, colour-coded ambiguity. The jargon is the problem. "Touchpoint," "moment of truth," "emotional arc," "pain point" — every person in the workshop has a slightly different definition, and the tool they are using rarely forces the issue.
This guide cuts through that. It defines the terms that matter, explains what each category of journey mapping tool actually does, and gives CX leaders a clear basis for choosing the right instrument for the right job. No vague rankings, no fabricated statistics, no breathless vendor endorsements.
The short answer: Journey mapping tools are software or structured frameworks that help organisations visualise, analyse, and improve the sequence of interactions a customer has with a brand. The best ones do more than draw diagrams — they connect the emotional arc of the experience to operational data, score each moment, and translate insight into action. The worst ones produce beautiful slides that nobody opens six months later.
Why the Jargon Problem Is Also a Strategy Problem
CX practitioners borrow freely from service design, UX, management consulting, and behavioural science. The result is a vocabulary that sounds precise but rarely is. When a Head of Experience tells a Chief Operating Officer that a particular touchpoint is a "moment of truth," the COO may nod — and picture something entirely different from what was meant. When a workshop facilitator asks participants to rate the "emotional intensity" of a step, half the room is thinking about frustration and the other half is thinking about delight. The tool captures both as a single number and calls it insight.
This matters because journey mapping is not a design exercise — it is a decision-making exercise. The map exists to tell someone where to invest, what to fix, and in what order. Ambiguous language produces ambiguous maps, which produce ambiguous priorities, which produce nothing at all. Clarifying the jargon is not pedantry; it is the precondition for action.
The Core Vocabulary: Defined Precisely
Journey
The complete sequence of interactions a customer has with an organisation in pursuit of a specific goal — from the moment the need arises to the moment it is resolved (or abandoned). A journey has a beginning and an end, and it crosses multiple channels and departments. It is not a process map, which describes what the organisation does; it describes what the customer experiences.
Stage
A named phase of the journey that groups related steps together. "Awareness," "Onboarding," "Resolution," and "Renewal" are stages. They are useful for communication and structure, but they are not the unit of analysis — steps and touchpoints are.
Step
A discrete action the customer takes within a stage. "Submitting a claim form," "waiting for a callback," "receiving a confirmation email" — each is a step. Steps are where friction lives and where improvement is possible.
Touchpoint
The specific interaction between the customer and the organisation at a given step — defined by channel (app, branch, phone, email), the customer's job-to-be-done at that moment, and what actually happens. Two customers can go through the same step via different touchpoints. This distinction matters enormously when diagnosing failure: the step may be fine; the channel may be broken.
Moment of Truth
A touchpoint whose outcome disproportionately shapes the customer's overall perception of the brand. The term originates with Jan Carlzon's work at SAS in the 1980s, but it has since been diluted by overuse. In practice, a moment of truth is identifiable by its asymmetric emotional weight: getting it right barely registers; getting it wrong is remembered. This is the peak-end rule in action — Daniel Kahneman's finding that people judge an experience by its most intense moment and its final moment, not by an average of every step. A good mapping tool surfaces these moments explicitly rather than treating all touchpoints as equal.
Emotional Arc
The plotted trajectory of customer sentiment across the journey — rising, falling, or flat at each step. The emotional arc is the single most diagnostic output a journey map can produce. A flat arc means the experience is forgettable. A sharply negative dip followed by a strong recovery can actually build loyalty, because the recovery becomes the peak. A gradual decline with no recovery is the signature of churn. Tools that only capture the arc as a hand-drawn smiley-face line are not doing the job.
Pain Point
A step or touchpoint where the customer's experience falls materially below their expectation. Not every friction point is a pain point — some friction is functional and even trust-building (a security check, a confirmation step). A pain point is friction that serves no purpose the customer values. Conflating all friction with pain leads to over-engineered, frictionless experiences that feel cheap or unsafe.
Experience Score
A quantified rating of a touchpoint's quality, distinct from a satisfaction score. Satisfaction scores (NPS, CSAT, CES) measure what customers report; an experience score measures what the design of the touchpoint deserves. The two should correlate — and when they do not, the gap is diagnostic gold. René Studio, Renascence's AI-native CX design platform, operationalises this through its EXIS (Experience Impact Score) engine, which rates each touchpoint on a −5 to +5 scale using a transparent, deterministic methodology rather than a raw sentiment guess.
Service Blueprint
The operational twin of a customer journey map. Where the journey map shows what the customer experiences, the service blueprint shows what the organisation must do to deliver it — the frontstage actions visible to the customer, the backstage actions invisible to them, and the support processes that enable both. Many organisations map journeys without blueprinting the service, then wonder why the map never changes anything. The blueprint is where accountability lives.
What Journey Mapping Tools Actually Do — and What They Don't
The market for journey mapping tools ranges from free whiteboard applications to enterprise CX platforms costing hundreds of thousands of pounds annually. Most buyers choose based on interface and price. The better question is: what job does this tool do, and is that the job I need done?
There are four distinct jobs, and most tools do one or two of them well.
Job 1: Visualisation
Drawing the map — arranging stages, steps, touchpoints, and emotional ratings into a readable diagram. This is the job most tools focus on. Miro, Lucidchart, and similar whiteboard platforms do this adequately. The risk is that visualisation becomes the end product rather than the means to an end. A beautiful map that lives in a slide deck and is never updated is a monument to a workshop, not a management tool.
Job 2: Scoring and Analysis
Quantifying the experience at each touchpoint so that comparisons are possible — across steps, journeys, customer segments, and time. This is where most tools fall short. Scoring requires a methodology, not just a field to type a number into. Without a consistent scoring framework, two facilitators running the same journey produce incomparable results. Tools that embed a scoring engine — rather than leaving the methodology to the user — produce maps that can be aggregated, trended, and reported to leadership.
Job 3: Connecting to Evidence
Anchoring the map to real customer data — verbatim feedback, complaint logs, mystery shopping results, NPS driver analysis, call centre themes. A journey map built entirely on internal assumptions is a hypothesis, not a diagnosis. The Voice of Customer layer is what converts a workshop output into something defensible in a boardroom. Tools that allow VoC data to be plotted directly against the journey — so that a touchpoint's score sits alongside the customer quotes that explain it — are materially more useful than those that treat the map and the feedback as separate artefacts.
Job 4: Translating to Action
Converting the map's findings into a tracked improvement roadmap — with owners, priorities, timelines, and a mechanism for distinguishing the current state from the target state. This is the job almost no tool does well by default, because it requires the map to be a living document rather than a deliverable. The failure mode is familiar: a workshop produces a map, the map is presented to leadership, leadership nods, and the map is filed. Six months later, nothing has changed and nobody can remember what the priorities were.
Free vs. Paid Tools: What You Actually Get
Free journey mapping tools — including the free tiers of Miro, FigJam, and various template libraries — are adequate for one job: visualisation. They are useful for workshops, for getting a cross-functional team to agree on a shared picture, and for early-stage discovery work where the goal is alignment rather than analysis.
They are not adequate for scoring, for connecting to VoC data at scale, or for managing an improvement roadmap across a large organisation. Asking a free whiteboard tool to do those jobs is like asking a napkin sketch to serve as an architectural drawing. The sketch is valuable; it is just not the same thing.
Paid tools vary enormously. The meaningful distinctions are not price-tier but methodology-depth: does the tool embed a scoring framework, or does it leave that to the user? Does it connect to operational data sources, or is it a standalone diagram? Does it support a current-state / future-state / deployed lifecycle, or does it only capture one moment in time? These questions matter more than the feature list on the vendor's homepage.
For organisations serious about customer experience as a managed discipline, the tool choice is a governance decision as much as a software decision. The tool shapes what gets measured, what gets reported, and therefore what gets improved.
The Behavioural Economics Dimension Most Tools Ignore
Standard journey mapping captures what happens and how customers feel about it. Behavioural economics asks a harder question: why do customers feel and behave the way they do, even when it seems irrational?
Two mechanisms are particularly important for journey design and are routinely absent from mapping tools.
The first is loss aversion. Customers weight losses roughly twice as heavily as equivalent gains — a finding central to Kahneman and Tversky's Prospect Theory, published in Econometrica in 1979. This means that a touchpoint which removes something the customer expected (a benefit, a discount, a convenience) will damage the emotional arc far more than an equivalent positive touchpoint will improve it. Journey maps that treat positive and negative moments symmetrically — a +1 for a good interaction, a −1 for a bad one — systematically underestimate the damage done by negative steps.
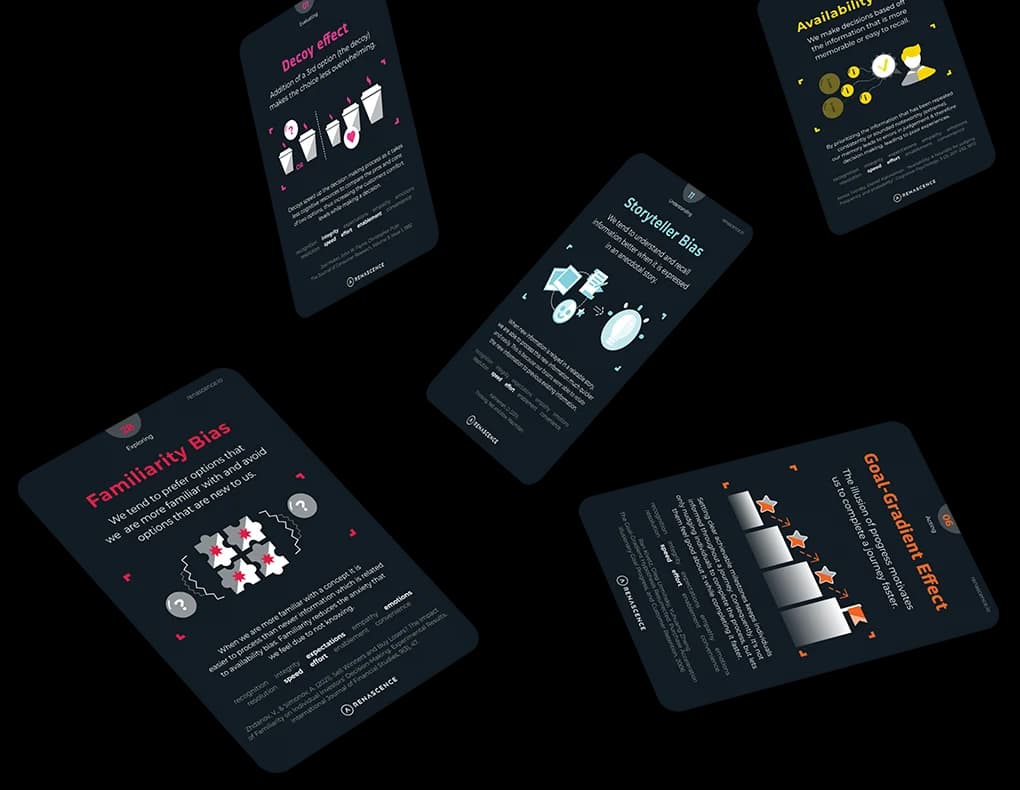
The second is goal-gradient. Customers accelerate effort as they approach a goal — they are more motivated, more tolerant of friction, and more forgiving of errors when they can see the finish line. This means that friction placed early in a journey (during awareness or onboarding) is far more damaging to completion rates than equivalent friction placed late. A tool that treats all steps in a journey as equally weighted ignores this entirely.
Embedding these mechanisms into a mapping methodology — not just into the facilitator's head — is what separates a behavioural economics-informed approach from a conventional one. It changes which touchpoints get prioritised and which interventions get designed.
How to Choose the Right Tool for Your Organisation
There is no universally best journey mapping tool. There is only the right tool for the job you need done, at the maturity level your organisation is actually at.
Work through these questions in order:
- What is the primary output you need? A workshop artefact for alignment? A scored, data-connected map for leadership reporting? A living roadmap for operational improvement? Each requires a different tool.
- What is your organisation's CX maturity? A team that has never mapped a journey before will not benefit from a sophisticated scoring engine — they need something that helps them agree on what they are mapping. A mature CX function that already has VoC data and a governance structure needs a tool that connects those elements. Use a CX maturity assessment to establish where you are before choosing where to invest.
- Who will use it, and how often? A tool used once a year in a workshop has different requirements from one used weekly by a CX operations team. Frequency of use determines how important the scoring methodology and update workflow are relative to the workshop facilitation features.
- Does it embed a methodology, or does it require you to supply one? If the tool is methodology-agnostic, you need to be confident that your team will apply a consistent framework every time. Most organisations cannot sustain that discipline. A tool that encodes the methodology — defining what a touchpoint is, how it is scored, what constitutes a moment of truth — produces more consistent and comparable outputs over time.
- How does it connect to your existing data? A journey map that cannot be updated with real customer feedback will drift from reality within months. Ask specifically how the tool handles VoC integration, and what the workflow is for keeping the map current.
What Leadership Needs From a Journey Map That Most Tools Don't Deliver
Senior leaders are not interested in journey maps. They are interested in the decisions that journey maps should inform: where to invest capital, where to reduce cost, which problems to fix first, and what the return will be. A map that does not answer those questions — clearly, in the language of the business — will not survive contact with a CFO.
The gap between what most journey mapping tools produce and what leadership actually needs is structural, not cosmetic. It has three dimensions.
First, aggregation. A single journey map for a single persona is a starting point. Leadership needs to see patterns across journeys, segments, and channels — which stages are consistently weak, which touchpoints drive the most churn, where the biggest gap between current and target state exists. Tools that produce individual maps but cannot aggregate across them leave that synthesis work to the analyst, who typically does it in a spreadsheet that nobody trusts.
Second, financial connection. The map needs to connect to a number — churn rate, resolution cost, lifetime value — so that a decision to invest in improving a touchpoint can be evaluated against a return. This is not the tool's job alone; it requires the organisation to have done the work of connecting CX metrics to financial outcomes. But a tool that makes that connection possible — by attaching business data to touchpoints — is far more useful to a leadership team than one that does not.
Third, accountability. Every improvement identified on a journey map needs an owner, a deadline, and a mechanism for tracking whether it happened. Without that, the map is a wish list. The CX implementation roadmap is the bridge between the map and the organisation's operating rhythm — and it needs to be built into the tool, not managed separately.
The PDF Problem
A significant portion of journey mapping work ends as a PDF. The map is exported, distributed, presented, and filed. This is not a technology problem — it is a governance problem. The PDF is the symptom of an organisation that has treated journey mapping as a project rather than a practice.
A journey map that is exported to PDF has, by definition, stopped being a management tool. It is now a historical document. The moment it was exported, the real world started diverging from it. Six months later, the touchpoints it describes may have changed, the emotional arc may have shifted, and the priorities it identified may have been superseded — but the PDF still circulates, and people still reference it as if it were current.
The antidote is not a better export format. It is a governance model that treats the journey map as a living system — updated on a defined cadence, connected to VoC data, and linked to an active improvement roadmap. The CX governance strategy determines whether the map stays alive or becomes a relic. The tool enables it; the governance sustains it.
The Standard Worth Holding
Journey mapping tools are only as good as the discipline surrounding them. The best tool in the world, used without a clear methodology, consistent scoring, real customer evidence, and a governance model that keeps the map current, produces expensive wallpaper. The simplest tool, used rigorously and connected to operational decision-making, can transform how an organisation understands and improves its customer experience.
The jargon matters because it is the foundation of that rigour. When everyone in the room means the same thing by "touchpoint," "moment of truth," and "emotional arc," the map they build together is a shared reality rather than a shared misunderstanding. And a shared reality — precise, evidence-backed, connected to action — is the only kind of journey map that changes anything.
If your organisation is ready to move from maps as deliverables to maps as management tools, the place to start is not the tool selection — it is the methodology. Get that right, and the tool choice becomes straightforward. Get it wrong, and no tool will save you.
Further reading
FAQ
Questions we get on this topic
Related reading



Stay ahead of CX
Get the Journal in your inbox.
Insights, frameworks and event round-ups from the Renascence team. No spam, ever.